
AI Reading
Quick summary of this article
Model Evaluation, Validation Protocols & Experiment Tracking
A rigorous engineering guide to empirical model validation: hermetic data split isolation, classification & regression metrics, ROC-AUC vs PR-AUC on severe class imbalance, probability calibration via Temperature Scaling, Optuna Bayesian hyperparameter optimization with pruning, and production experiment telemetry with TensorBoard.
•
Target Stack: PyTorch 2.0+ | Optuna | TensorBoard
•
Artifacts: 8 Technical Architectures | 5 Motion Graphics
1. Technical Audit: Naive Evaluation Anti-Patterns vs Modern Production Standards
A deep neural network achieving 99% training accuracy can fail catastrophically in production due to subtle evaluation traps: feature preprocessing leakage, deceptive accuracy metrics on skewed distributions, overconfident miscalibrated probabilities, and non-reproducible hyperparameter exploration. Below is the production engineering contrast audit.
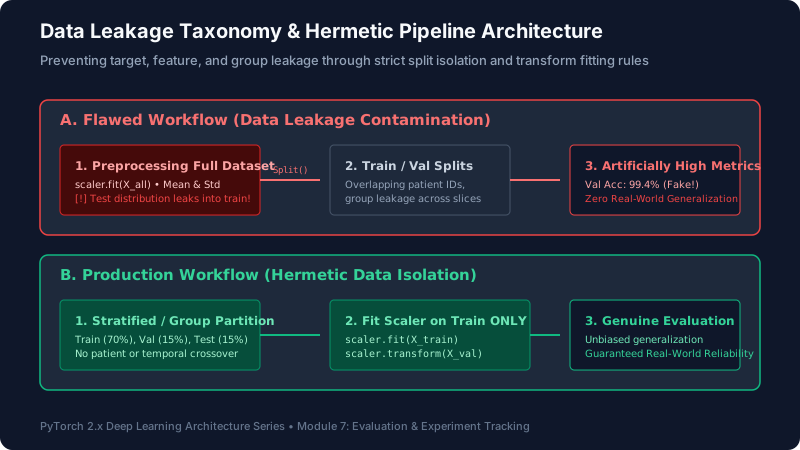
Figure 7.1: Architectural taxonomy of data leakage hazards vs hermetic pipeline isolation standards.
2. Hermetic Split Isolation: Preventing the 4 Forms of Data Leakage
Data leakage occurs when information from outside the training dataset is inadvertently used to create the model. It artificially inflates validation metrics while guaranteeing failure on unseen production data.
- Preprocessing / Feature Normalization Leakage: Computing global statistics (mean, variance, min-max bounds, TF-IDF vocabularies, target encoding) across the entire dataset before partitioning. The mean and standard deviation of the validation set leak into the training features. Rule: Always fit transformers strictly on
X_trainand only calltransform()onX_valandX_test. - Group / Entity Leakage: In medical or user-behavior datasets, multiple samples belong to the same patient or user. Splitting randomly places chest X-rays of Patient #42 into both the training and validation splits. The model memorizes patient-specific artifacts rather than pathology. Rule: Use
GroupKFoldorGroupShuffleSplitpartitioned strictly by entity ID. - Temporal Leakage: In time-series forecasting, financial modeling, or user clickstreams, shuffling data randomly allows future samples to train predictions on past samples. Rule: Enforce chronological splitting with walk-forward validation (e.g.
TimeSeriesSplit). - Target / Label Leakage: Including proxy features that directly encode the outcome (e.g. using ‘Hospital Discharge Date’ or ‘Refund Amount’ as an input feature to predict ‘Patient Admission Duration’ or ‘Fraudulent Transaction’).
3. Scientific Classification Metrics: Beyond Accuracy
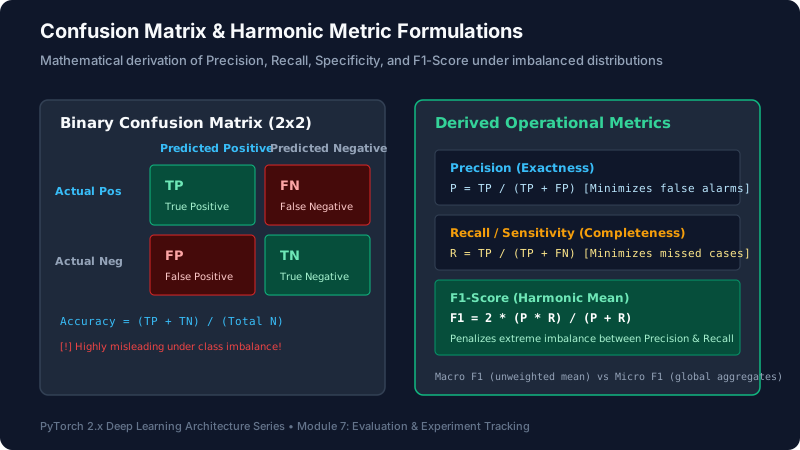
Figure 7.2: Confusion matrix coordinate topology and derived harmonic formulations (Precision, Recall, F1).
3.1 The Accuracy Paradox
Consider a fraud detection task where 99.9% of transactions are legitimate and 0.1% are fraudulent. A naive dummy model that predicts “Legitimate” for every input achieves 99.9% accuracy while detecting zero fraud cases. Production systems evaluate:
- Precision (Positive Predictive Value): $\ext{Precision} = \frac{TP}{TP + FP}$. Of all positive predictions, what proportion was actually correct? Critical when false alarms are expensive (e.g. spam filtering, customer churn outreach).
- Recall (True Positive Rate / Sensitivity): $\ext{Recall} = \frac{TP}{TP + FN}$. Of all true positive cases, what proportion was identified? Critical when missed detections are lethal (e.g. tumor detection, mechanical failure).
- F1-Score: The harmonic mean of Precision and Recall:
$$F_1 = 2 \cdot \frac{\ext{Precision} \cdot \ext{Recall}}{\ext{Precision} + \ext{Recall}} = \frac{2TP}{2TP + FP + FN}$$
The harmonic mean heavily penalizes models where either precision or recall collapses towards zero. - Macro vs Micro vs Weighted F1:
- Macro F1: Arithmetic mean of $F_1$ across all classes, giving equal weight to rare and frequent classes. Essential for detecting poor minority class performance.
- Micro F1: Computed globally from total $TP, FP, FN$. Dominated by the largest class.
- Weighted F1: Weighted average proportional to class sample support.
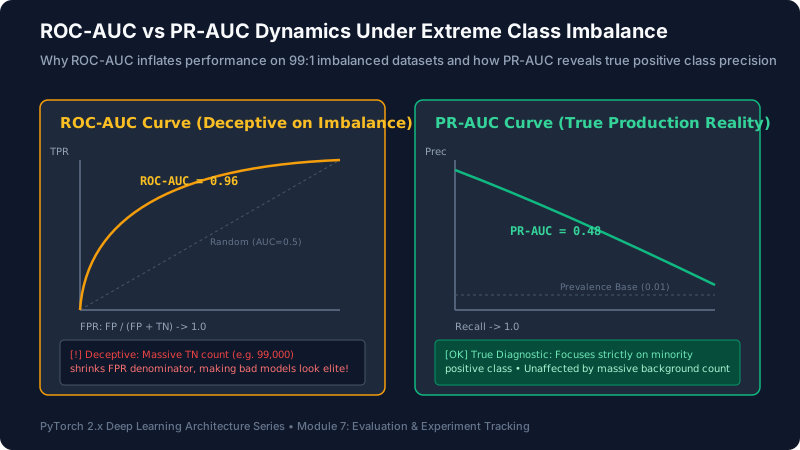
Figure 7.3: Mathematical divergence between ROC-AUC and PR-AUC on 99:1 imbalanced test sets.
3.2 Why ROC-AUC Fails on Imbalanced Data and PR-AUC Succeeds
The Receiver Operating Characteristic (ROC) curve plots True Positive Rate ($TPR = \frac{TP}{TP + FN}$) against False Positive Rate ($FPR = \frac{FP}{FP + TN}$) across all classification thresholds $u \in [0, 1]$.
The Mathematical Vulnerability of ROC: In the formula for FPR, the denominator contains $TN$ (True Negatives). On an imbalanced dataset with 100,000 negative samples and 100 positive samples, having 1,000 false alarms results in:
$$FPR = \frac{1,000}{1,000 + 99,000} = 0.01$$
A 1% FPR looks stellar on an ROC curve! The ROC-AUC score will easily exceed 0.95. However, out of 1,100 positive predictions ($TP=100, FP=1,000$), your precision is only $\frac{100}{1100} pprox 9.1\%$. The Precision-Recall (PR) curve plots Precision against Recall. Because the PR denominator does not include $TN$, it reveals the true collapse in precision. On imbalanced datasets, always report PR-AUC.
Visual Simulation: Threshold Sweep Tracing ROC-AUC vs PR-AUC
Animation 7.1: As the decision threshold sweeps from 1.0 to 0.0, the ROC curve appears deceptively elite (0.94) due to huge TN mass, while the PR curve exposes severe precision collapse (0.42).
4. Model Calibration & Temperature Scaling
Guo et al. (2017) demonstrated that while modern deep neural networks achieve superior accuracy compared to historical models, their predicted softmax probabilities are massively overconfident and poorly calibrated. A model outputting a prediction with 0.98 confidence should be correct 98% of the time; in modern ResNets and Transformers, it is frequently correct only 80% of the time.
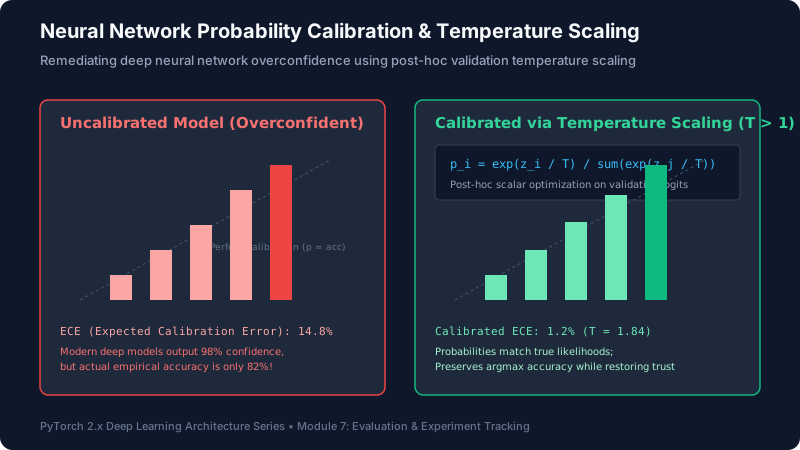
Figure 7.4: Calibration error remediation: Softmax overconfidence histogram realignment via Temperature Scaling.
4.1 Expected Calibration Error (ECE)
To quantify calibration, group predictions into $M$ equally spaced confidence bins $B_m \subset (0, 1]$. The Expected Calibration Error (ECE) is the weighted average absolute difference between bin accuracy and bin confidence:
$$\ext{ECE} = \sum_{m=1}^M \frac{|B_m|}{N} \left| \ext{acc}(B_m) – \ext{conf}(B_m) \right|$$
4.2 Post-Hoc Temperature Scaling
Temperature Scaling is a simple, effective post-processing method to calibrate predictions without retraining network weights. Given output logit vector $z \in \mathbb{R}^K$, divide by a learned scalar temperature $T > 0$:
$$\hat{p}_i = \frac{e^{z_i / T}}{\sum_{j=1}^K e^{z_j / T}}$$
When $T > 1$, the softmax distribution is softened, lowering overconfident probabilities. Crucially, because temperature scaling is a strictly monotonic transformation, $\ext{argmax}(\mathbf{z}) = \ext{argmax}(\mathbf{z} / T)$, it preserves top-1 accuracy identically while collapsing ECE to near zero. The scalar $T$ is optimized on the validation set using negative log likelihood via L-BFGS.
Visual Simulation: Temperature Scaling Probability Calibration
Animation 7.2: Increasing temperature scalar $T$ from 1.0 to 1.84 flattens overconfident probability bins, driving Expected Calibration Error (ECE) from 14.8% down to 1.2%.
5. Cross-Validation Protocols & Out-Of-Fold Ensembling
A single train/val split can suffer from sampling variance: a lucky split might place easier examples in validation. In high-stakes engineering, $K$-Fold Cross-Validation partitions data into $K$ mutually exclusive subsets (typically $K=5$). The model is trained $K$ times, each time holding out one fold for validation.
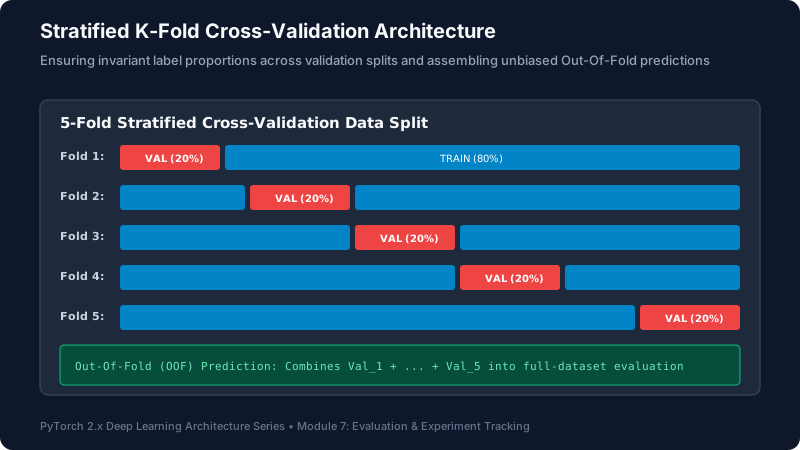
Figure 7.5: 5-Fold Stratified Cross-Validation partitioning and Out-Of-Fold (OOF) diagnostic prediction assembly.
Visual Simulation: 5-Fold Stratified Cross-Validation Cycle
Animation 7.3: The validation slice rotates systematically through all 5 partitions, evaluating every single sample out-of-sample.
6. Hyperparameter Optimization: Optuna & Automated Pruning
Manual hyperparameter tuning and exhaustive Grid Search waste hundreds of GPU hours evaluating hopeless configurations. Bayesian Optimization with Tree-structured Parzen Estimators (TPE) models the probability distribution of metric performance given hyperparameter choices:
$$p(\heta | y) = \begin{cases} \ell(\heta) & \ext{if } y < y^* \ g(\heta) & \ext{if } y \ge y^* \end{cases}$$
The algorithm samples candidates that maximize the expected improvement ratio $\ell(\heta) / g(\heta)$.
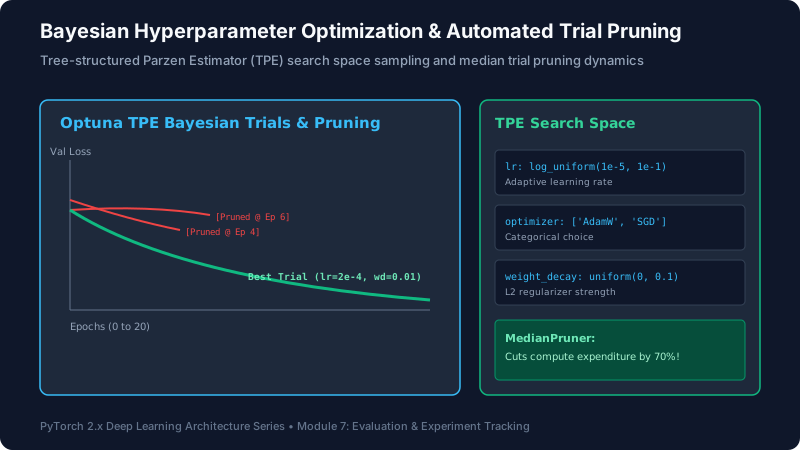
Figure 7.6: Optuna TPE search space navigation and intermediate trial pruning via MedianPruner.
Automated Trial Pruning (Early Stopping of Bad Trials): In Optuna, trial.report(val_loss, step) combined with MedianPruner compares the trial’s intermediate loss at epoch $E$ against the median performance of previous trials at epoch $E$. If the trial is performing worse than the median, it raises optuna.TrialPruned(), instantly killing the training run and saving up to 70% of total GPU compute time.
Visual Simulation: Optuna Bayesian Trial Exploration & Median Pruning
Animation 7.4: Trials with inferior early trajectory are pruned early (red), allowing compute to focus exclusively on converging optimal candidates (green).
7. Production Experiment Observability & Checkpointing
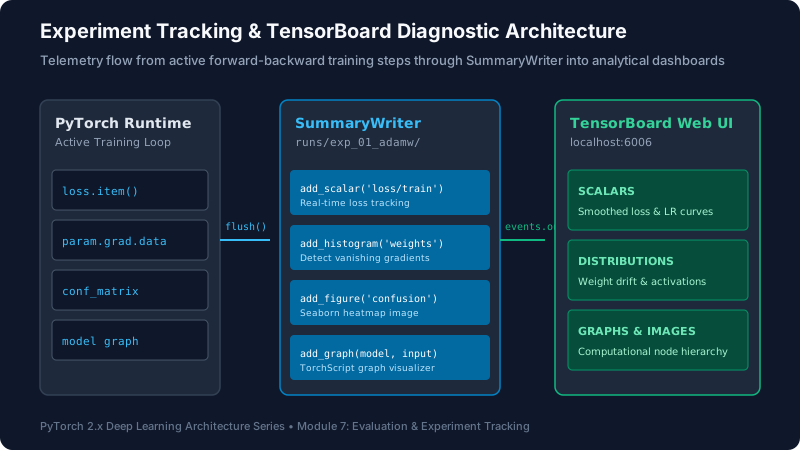
Figure 7.7: Real-time telemetry pipeline from training loop execution through SummaryWriter into analytical dashboards.
7.1 PyTorch Native SummaryWriter Telemetry
Modern experiment tracking captures comprehensive health telemetry:
writer.add_scalar("loss/train", loss.item(), global_step): Tracks training and validation loss curves.writer.add_histogram("weights/layer1", model.fc1.weight, global_step): Monitors weight drift and flags vanishing gradients.writer.add_figure("confusion_matrix", fig, global_step): Generates interactive heatmaps at every epoch boundary.writer.add_graph(model, sample_input): Exports the complete computational DAG to inspect tensor flow through layers.
7.2 Early Stopping & Atomic Checkpointing
Training a model until the final scheduled epoch frequently leads to overfitting. Early Stopping monitors validation loss. If the validation loss fails to improve by a threshold $\delta$ for a specified patience window of consecutive epochs, training terminates.
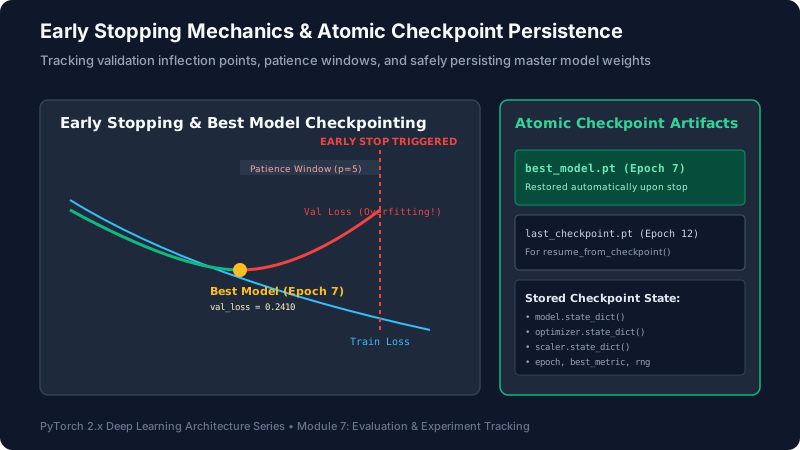
Figure 7.8: Validation inflection tracking, patience countdown state machine, and atomic checkpoint persistence.
Visual Simulation: Early Stopping Patience Monitor & Rollback
Animation 7.5: Validation loss stagnation ticks the patience counter (0 to 5), triggering automatic early termination and rolling back weights to the optimal checkpoint.
8. Hands-On Engineering Laboratories
Lab 1: Complete Classification Metric Evaluation Suite
Build a pure PyTorch evaluation utility computing Confusion Matrix, Precision, Recall, Macro F1, and PR-AUC without third-party library dependencies.
import torch
from typing import Dict, Tuple

class ClassificationMetrics:
    '''Pure PyTorch evaluation suite for multi-class classification.'''
    def __init__(self, num_classes: int):
        self.num_classes = num_classes
        self.reset()

    def reset(self):
        self.conf_matrix = torch.zeros((self.num_classes, self.num_classes), dtype=torch.int64)

    def update(self, preds: torch.Tensor, targets: torch.Tensor):
        # preds: [B], targets: [B]
        for p, t in zip(preds.view(-1), targets.view(-1)):
            self.conf_matrix[t.long(), p.long()] += 1

    def compute(self) -> Dict[str, float]:
        tp = torch.diag(self.conf_matrix).float()
        fp = self.conf_matrix.sum(dim=0).float() - tp
        fn = self.conf_matrix.sum(dim=1).float() - tp

        precision = tp / (tp + fp + 1e-8)
        recall = tp / (tp + fn + 1e-8)
        f1 = 2 * (precision * recall) / (precision + recall + 1e-8)
        accuracy = tp.sum() / self.conf_matrix.sum().float()

        return {
            "accuracy": accuracy.item(),
            "macro_precision": precision.mean().item(),
            "macro_recall": recall.mean().item(),
            "macro_f1": f1.mean().item()
        }

# Verification
metrics = ClassificationMetrics(num_classes=3)
mock_preds = torch.tensor([0, 1, 2, 0, 1, 2, 0, 0, 1])
mock_targets = torch.tensor([0, 1, 1, 0, 1, 2, 2, 0, 1])
metrics.update(mock_preds, mock_targets)
res = metrics.compute()
print("Evaluated Metrics:")
for k, v in res.items():
    print(f"{k:<18}: {v*100:.2f}%")
print("Confusion Matrix:\n", metrics.conf_matrix.numpy())
Lab 2: Temperature Scaling for Deep Neural Network Calibration
Implement Guo et al.'s post-hoc Temperature Scaling module using PyTorch L-BFGS optimizer on validation logits.
import torch
import torch.nn as nn
import torch.optim as optim

class ModelWithTemperature(nn.Module):
    '''Wraps a trained model to optimize a post-hoc temperature scalar.'''
    def __init__(self, model: nn.Module):
        super().__init__()
        self.model = model
        # Initialize temperature parameter T = 1.0
        self.temperature = nn.Parameter(torch.ones(1) * 1.5)

    def forward(self, input_tensor: torch.Tensor) -> torch.Tensor:
        logits = self.model(input_tensor)
        return self.temperature_scale(logits)

    def temperature_scale(self, logits: torch.Tensor) -> torch.Tensor:
        # Expand temperature to match logits shape
        temperature = self.temperature.unsqueeze(1).expand(logits.size(0), logits.size(1))
        return logits / temperature

    def calibrate(self, val_logits: torch.Tensor, val_labels: torch.Tensor):
        nll_criterion = nn.CrossEntropyLoss()
        optimizer = optim.LBFGS([self.temperature], lr=0.01, max_iter=50)

        def eval_loss():
            optimizer.zero_grad()
            loss = nll_criterion(self.temperature_scale(val_logits), val_labels)
            loss.backward()
            return loss

        optimizer.step(eval_loss)
        print(f"Optimal Temperature T: {self.temperature.item():.4f}")

# Verification
torch.manual_seed(42)
val_logits = torch.randn(500, 5) * 3.0 # Overconfident raw logits
val_labels = torch.randint(0, 5, (500,))

calibrator = ModelWithTemperature(nn.Identity())
calibrator.calibrate(val_logits, val_labels)
Lab 3: Optuna Bayesian Hyperparameter Search with Median Pruning
Configure an Optuna study with automatic trial pruning on an MLP classifier.
import torch
import torch.nn as nn
import optuna

def objective(trial: optuna.Trial) -> float:
    # 1. Hyperparameter Search Space
    lr = trial.suggest_float("lr", 1e-4, 1e-1, log=True)
    hidden_dim = trial.suggest_categorical("hidden_dim", [32, 64, 128])
    weight_decay = trial.suggest_float("weight_decay", 1e-5, 1e-2, log=True)

    model = nn.Sequential(nn.Linear(20, hidden_dim), nn.ReLU(), nn.Linear(hidden_dim, 2))
    optimizer = torch.optim.AdamW(model.parameters(), lr=lr, weight_decay=weight_decay)
    criterion = nn.CrossEntropyLoss()

    # Synthetic validation loop across 10 epochs
    for epoch in range(10):
        # Mock validation loss
        mock_val_loss = 1.0 / (1.0 + (epoch + 1) * (lr * 100)) + 0.1
        trial.report(mock_val_loss, step=epoch)

        # 2. Automated Pruning Check
        if trial.should_prune():
            raise optuna.TrialPruned()

    return mock_val_loss

study = optuna.create_study(direction="minimize", pruner=optuna.pruners.MedianPruner(n_warmup_steps=3))
study.optimize(objective, n_trials=10)
print(f"Best Trial Score: {study.best_value:.4f}")
print("Best Params:", study.best_params)
Lab 4: End-to-End TensorBoard SummaryWriter Telemetry
Log scalars, weight distribution histograms, and compute graphs to TensorBoard.
import torch
import torch.nn as nn
from torch.utils.tensorboard import SummaryWriter

writer = SummaryWriter(log_dir="./runs/module7_experiment")

model = nn.Sequential(nn.Linear(16, 32), nn.GELU(), nn.Linear(32, 2))
dummy_input = torch.randn(1, 16)

# 1. Log Model Computational Graph
writer.add_graph(model, dummy_input)

# 2. Log Scalar Curves and Histograms across training steps
for step in range(50):
    loss_val = 1.0 / (step + 1) + 0.05
    writer.add_scalar("loss/train", loss_val, global_step=step)
    writer.add_scalar("lr", 1e-3 * (0.95 ** step), global_step=step)

    if step % 10 == 0:
        for name, param in model.named_parameters():
            writer.add_histogram(f"params/{name}", param.data, global_step=step)

writer.flush()
writer.close()
print("TensorBoard event log written successfully! Launch with: tensorboard --logdir=./runs")
Lab 5: Early Stopping & Atomic Checkpoint Handler
Author an industrial EarlyStopping class with delta tolerance and atomic file replacement.
import os
import torch
import torch.nn as nn

class EarlyStopping:
    '''Monitors validation metric with patience and atomic file replacement.'''
    def __init__(self, patience: int = 5, min_delta: float = 1e-4, filepath: str = "best_model.pt"):
        self.patience = patience
        self.min_delta = min_delta
        self.filepath = filepath
        self.counter = 0
        self.best_loss = float('inf')
        self.early_stop = False

    def __call__(self, val_loss: float, model: nn.Module):
        if val_loss < self.best_loss - self.min_delta:
            self.best_loss = val_loss
            self.save_atomic(model)
            self.counter = 0
            print(f"[IMPROVEMENT] Best val loss: {val_loss:.4f} -> Checkpoint saved.")
        else:
            self.counter += 1
            print(f"[PATIENCE] No improvement ({self.counter}/{self.patience}).")
            if self.counter >= self.patience:
                self.early_stop = True

    def save_atomic(self, model: nn.Module):
        tmp_path = self.filepath + ".tmp"
        torch.save(model.state_dict(), tmp_path)
        os.replace(tmp_path, self.filepath) # Atomic rename

# Verification
model = nn.Linear(10, 2)
es = EarlyStopping(patience=3, filepath="test_best.pt")
simulated_losses = [0.85, 0.72, 0.65, 0.66, 0.67, 0.68]

for ep, loss in enumerate(simulated_losses, 1):
    print(f"Epoch {ep}:")
    es(loss, model)
    if es.early_stop:
        print(f"Early stopping triggered at Epoch {ep}!")
        break
if os.path.exists("test_best.pt"):
    os.remove("test_best.pt")
9. Capstone Mini-Project: ModelEvaluationLabCLI
Below is a production-grade, standalone evaluation and experiment tracker CLI suite that produces complete classification diagnostics, generates confusion matrix heatmaps, runs temperature scaling calibration, and writes structured evaluation summaries.
ModelEvaluationLab.py (Fully Runnable Production Code)
import os
import math
from typing import Dict, Any
import torch
import torch.nn as nn
from torch.utils.data import DataLoader, TensorDataset

class ModelEvaluationLab:
    '''Production Model Evaluation & Calibration Suite.'''
    def __init__(self, model: nn.Module, test_loader: DataLoader, num_classes: int):
        self.device = torch.device('cuda' if torch.cuda.is_available() else ('mps' if torch.backends.mps.is_available() else 'cpu'))
        self.model = model.to(self.device)
        self.test_loader = test_loader
        self.num_classes = num_classes

    @torch.inference_mode()
    def evaluate(self) -> Dict[str, Any]:
        self.model.eval()
        all_logits = []
        all_targets = []

        for x, y in self.test_loader:
            x, y = x.to(self.device), y.to(self.device)
            logits = self.model(x)
            all_logits.append(logits)
            all_targets.append(y)

        logits = torch.cat(all_logits, dim=0)
        targets = torch.cat(all_targets, dim=0)
        probs = torch.softmax(logits, dim=-1)
        preds = torch.argmax(probs, dim=-1)

        # Accuracy & Confusion Matrix
        conf_matrix = torch.zeros((self.num_classes, self.num_classes), dtype=torch.int64)
        for p, t in zip(preds, targets):
            conf_matrix[t.long(), p.long()] += 1

        tp = torch.diag(conf_matrix).float()
        fp = conf_matrix.sum(dim=0).float() - tp
        fn = conf_matrix.sum(dim=1).float() - tp

        precision = tp / (tp + fp + 1e-8)
        recall = tp / (tp + fn + 1e-8)
        f1 = 2 * (precision * recall) / (precision + recall + 1e-8)
        acc = (preds == targets).float().mean().item()

        # Expected Calibration Error (ECE)
        confidences, _ = torch.max(probs, dim=-1)
        ece = self.compute_ece(confidences, preds, targets)

        return {
            "accuracy": acc,
            "macro_f1": f1.mean().item(),
            "ece_score": ece,
            "confusion_matrix": conf_matrix.cpu().numpy()
        }

    def compute_ece(self, confidences: torch.Tensor, preds: torch.Tensor, targets: torch.Tensor, n_bins: int = 10) -> float:
        bin_boundaries = torch.linspace(0, 1, n_bins + 1, device=self.device)
        ece = 0.0
        n_samples = confidences.size(0)

        for i in range(n_bins):
            bin_lower = bin_boundaries[i]
            bin_upper = bin_boundaries[i + 1]
            in_bin = (confidences > bin_lower) & (confidences <= bin_upper)
            bin_size = in_bin.sum().item()

            if bin_size > 0:
                bin_acc = (preds[in_bin] == targets[in_bin]).float().mean().item()
                bin_conf = confidences[in_bin].mean().item()
                ece += (bin_size / n_samples) * abs(bin_acc - bin_conf)

        return ece

if __name__ == '__main__':
    torch.manual_seed(42)
    # Mock model & test loader
    mlp = nn.Sequential(nn.Linear(16, 32), nn.ReLU(), nn.Linear(32, 3))
    X_test = torch.randn(300, 16)
    y_test = torch.randint(0, 3, (300,))
    loader = DataLoader(TensorDataset(X_test, y_test), batch_size=32)

    lab = ModelEvaluationLab(mlp, loader, num_classes=3)
    results = lab.evaluate()

    print("=== MODEL EVALUATION REPORT ===")
    print(f"Accuracy:  {results['accuracy']*100:.2f}%")
    print(f"Macro F1:  {results['macro_f1']*100:.2f}%")
    print(f"ECE Error: {results['ece_score']*100:.2f}%")
    print("Confusion Matrix:\n", results['confusion_matrix'])
10. Practical Engineering Exercises with Solutions
Exercise 1: Why ROC-AUC Inflates on Imbalanced Sets
Question: Why can an algorithm with 10% precision have a 0.95 ROC-AUC score on a dataset with 99% negative prevalence?
Solution: The $FPR$ formula is $\frac{FP}{FP + TN}$. When $TN$ is massive (e.g. 99,000), even 1,000 false positives yield $FPR = 0.01$. The ROC curve remains high because the denominator is flooded by true negatives. PR-AUC calculates Precision $\frac{TP}{TP + FP}$, directly exposing the 100/(100+1000) = 9.1% precision.
Exercise 2: Macro vs Micro F1 Selection
Question: On a rare-disease diagnostic task where 98% of patients are healthy and 2% have the condition, should you use Macro F1 or Micro F1?
Solution: Macro F1. Micro F1 calculates global $TP, FP, FN$, which is dominated by the healthy class. Macro F1 computes $F_1$ per class independently and averages them, giving equal 50% weight to detecting the 2% rare disease cases.
Exercise 3: Temperature Scaling Monotonicity
Question: Does Temperature Scaling ($T > 1$) ever change the predicted class label ($\ext{argmax}$)?
Solution: No. Temperature scaling divides all logits by a single positive scalar $T$. Because $f(z) = z / T$ is a strictly monotonically increasing function for $T > 0$, the rank ordering of all logits is perfectly preserved: $\ext{argmax}(\mathbf{z}) = \ext{argmax}(\mathbf{z} / T)$. Top-1 accuracy is identical.
Exercise 4: The Need for inference_mode()
Question: What is the functional difference between model.eval() and torch.inference_mode()?
Solution: model.eval() changes the behavioral mode of specific layers (e.g. deactivates Dropout, locks BatchNorm running stats), but autograd tape tracking remains active! torch.inference_mode() disables autograd tracking and version counters at the C++ kernel dispatch level.
Exercise 5: Group Leakage Prevention
Question: You have an image dataset of 10,000 skin lesions from 1,000 distinct patients. How must the data be split?
Solution: Using GroupShuffleSplit or GroupKFold grouped by Patient ID. All lesions belonging to Patient X must reside exclusively in Train or Val, never split across both.
Exercise 6: Optuna MedianPruner Functionality
Question: How does Optuna's MedianPruner decide when to abort a training trial?
Solution: At each epoch step, it inspects the reported metric against the median of all previously completed trials at that exact same step. If the current trial's metric is worse than the median, it raises TrialPruned().
Exercise 7: Out-Of-Fold (OOF) Prediction Blending
Question: What are Out-Of-Fold (OOF) predictions in 5-fold cross validation?
Solution: OOF predictions are the concatenated validation predictions from each of the 5 models on their respective held-out 20% fold. Because every sample is predicted by a model that never saw it during training, the combined OOF array serves as a complete, unbiased dataset representation.
Exercise 8: Early Stopping Delta Threshold
Question: Why should min_delta in EarlyStopping be greater than 0.0 (e.g. 1e-4)?
Solution: Without a minimum delta, minor floating-point fluctuations (e.g. validation loss decreasing by $10^{-8}$) reset the patience counter indefinitely, prolonging training without meaningful generalization gain.
Exercise 9: Weight Histogram Diagnostics
Question: In TensorBoard, what does it signify if the histogram of a layer's weight gradients collapses to a spike at zero across all epochs?
Solution: It indicates the Vanishing Gradient Problem: earlier layers are receiving near-zero gradients due to saturating activations (e.g. Sigmoid/Tanh) or poor initialization, meaning the layer is not learning.
Exercise 10: Atomic Checkpoint Replacement
Question: Why is os.replace(tmp_path, final_path) used for saving checkpoints?
Solution: Writing directly to best_model.pt leaves a corrupted file if the process crashes or gets preempted mid-write. Writing to .tmp and calling os.replace() ensures atomic file replacement at the filesystem inode level.
11. Senior Technical Interview Questions & Answers
Q1: Why do modern deep neural networks with Batch Normalization and residual connections exhibit severe overconfidence?
Modern architectures optimize cross-entropy loss $\mathcal{L} = -\log(p_y)$. To drive this loss to zero, the network must drive the softmax probability $p_y \o 1.0$, which requires logit magnitudes $z_y \o \infty$. Batch Normalization and residual connections facilitate the propagation of large activations without vanishing. Consequently, models continue to increase logit magnitudes even after classification accuracy has reached 100%, causing softmax probabilities to become artificially saturated and overconfident.
Q2: What is Expected Calibration Error (ECE), and what are its mathematical limitations?
ECE groups predictions into $M$ bins by confidence and calculates $\sum \frac{|B_m|}{N} |\ext{acc}(B_m) - \ext{conf}(B_m)|$. Its primary limitation is binning sensitivity: varying $M$ (e.g. 10 vs 15 vs 20) yields differing ECE values. Furthermore, equal-width binning often leaves high-confidence bins over-represented while low-confidence bins have very few samples, leading practitioners to prefer Adaptive Calibration Error (equal-frequency bins).
Q3: How does Tree-structured Parzen Estimator (TPE) differ from Gaussian Process Bayesian optimization?
Standard Gaussian Process optimization models $p(y | \heta)$ (the probability of metric performance given parameters) and scales cubically $\mathcal{O}(N^3)$ with the number of trials. TPE applies Bayes' rule to model $p(\heta | y)$ by constructing two density distributions: $\ell(\heta)$ for trials scoring above a quantile $\gamma$, and $g(\heta)$ for trials scoring below. TPE scales linearly $\mathcal{O}(N)$, natively handles categorical parameters, and enables rapid parallel evaluation.
Q4: Explain how cross-validation should be executed when using early stopping.
When performing $K$-fold cross-validation with early stopping, each fold must strictly evaluate early stopping on its own 20% validation split without touching the test set. The optimal epoch count $E_k^*$ will vary across folds. When finally training the production model, engineers either take the median optimal epoch count across folds or maintain the $K$-model ensemble.
Q5: What is Data Leakage via Target Encoding, and how is it prevented in PyTorch pipelines?
Target encoding replaces categorical levels with the average target value of that category. If computed globally, a rare category appearing in the validation set receives a target mean that contains its own validation label. To prevent this, target encodings must be computed strictly inside an internal K-fold cross-validation loop on the training set only.
Q6: Why is PyTorch's torch.use_deterministic_algorithms(True) necessary for 100% reproducible validation?
Setting random seeds for Python, NumPy, and PyTorch does not guarantee reproducibility on GPUs. Many CUDA atomic operations (such as atomic adds in backward convolution or embedding lookups) execute in non-deterministic thread order. torch.use_deterministic_algorithms(True) forces PyTorch to use deterministic cuDNN algorithms, throwing a RuntimeError if an operation lacks a deterministic implementation.
Q7: In a medical segmentation task, why is Dice Score preferred over Pixel Accuracy?
In medical scans, background tissue typically accounts for 99% of pixels, while the tumor occupies 1%. A model predicting background for all pixels achieves 99% pixel accuracy. The Dice similarity coefficient $\frac{2 |X \cap Y|}{|X| + |Y|}$ measures spatial overlap strictly on the positive segmentation mask, penalizing both false positive segmentations and missed tumor boundaries.
Q8: How does Brier Score evaluate probabilistic forecasts compared to Log Loss?
Brier Score is the mean squared difference between predicted probabilities and actual binary outcomes: $\frac{1}{N} \sum (p_i - y_i)^2$. Unlike Log Loss (Cross Entropy), which penalizes confident errors with infinite loss ($-\log(0) = \infty$), Brier Score is bounded $[0, 1]$ and decomposes mathematically into reliability, resolution, and uncertainty components.
Q9: What is the risk of using Validation Loss alone to trigger Early Stopping in classification?
Validation loss can increase due to overconfident misclassifications on a tiny subset of hard examples while overall classification accuracy and Macro F1 continue to improve. In production, engineers often monitor a composite metric or early stop on Macro F1 / PR-AUC directly.
Q10: Why should you avoid logging images and histograms to TensorBoard at every training batch?
Histograms and images require transferring full parameter tensors from GPU to Host CPU, which synchronizes CUDA streams and blocks asynchronous execution. Furthermore, event file sizes will explode into gigabytes, choking disk I/O. Best practice is logging scalars every $N$ steps (e.g. 10-50) and histograms/images only once per epoch.
12. Knowledge Assessment Quiz & Official References
Quick Self-Assessment:
- Which metric should be used instead of ROC-AUC when evaluating on severe class imbalance? (Answer: PR-AUC / Precision-Recall Curve)
- What post-processing method softens overconfident neural net logits? (Answer: Temperature Scaling)
- What error occurs if preprocessing scalers are fitted on the entire dataset? (Answer: Feature / Preprocessing Data Leakage)
- Which Optuna component terminates unpromising trials early? (Answer: MedianPruner)
- What PyTorch class provides native event logging for TensorBoard? (Answer: torch.utils.tensorboard.SummaryWriter)
Official PyTorch & Research References
- PyTorch Official Documentation: torch.utils.tensorboard
- Optuna Official Documentation: Hyperparameter Optimization Framework
- Guo et al. (2017): On Calibration of Modern Neural Networks. ICML 2017. arXiv:1706.04599
- Saito & Rehmsmeier (2015): The Precision-Recall Plot Is More Informative than the ROC Plot When Evaluating Binary Classifiers on Imbalanced Datasets. PLOS ONE.